Status Report March 2007
Table 1: Measured parameters given as GF3 codes (IOC 1987) and time periods covered by the BALTIC partners. SSAL is included in PSAL, HSUL is included in DOXY as negative oxygen equivalent.
| GF3 | IOW | SMHI | NERI/LS | MIRYB | IMGW | ICES | total |
|---|---|---|---|---|---|---|---|
| PSAL | 07.10.1951 – 28.11.2005 |
16.01.1979 – 13.12.2005 |
01.01.1900 – 23.12.2002 |
01.01.1946 – 22.11.1951 |
14.03.1979 – 10.11.2005 |
04.04.1900 – 04.03.2005 |
1891 – 2005 |
| TEMP | 07.10.1951 – 28.11.2005 |
16.01.1979 – 13.12.2005 |
01.01.1900 – 19.12.2002 |
01.01.1946 – 21.11.1951 |
14.03.1979 – 10.11.2005 |
04.04.1900 – 04.03.2005 |
1891 – 2005 |
| DOXY | 27.12.1951 – 04.11.2005 |
16.01.1979 – 13.12.2005 |
07.03.1985 – 23.12.2002 |
18.06.1946 – 21.11.1951 |
14.03.1979 – 10.11.2005 |
26.05.1900 – 14.12.2004 |
1900 – 2005 |
| AMON | 29.05.1968 – 04.11.2005 |
13.01.2002 – 13.12.2005 |
- | - | 14.03.1979 – 10.11.2005 |
17.01.1996 – 14.12.2004 |
1968 – 2005 |
| NTRA | 15.11.1967 – 04.11.2005 |
16.01.1979 – 13.12.2005 |
- | - | 14.03.1979 – 10.11.2005 |
12.07.1928 – 14.12.2004 |
1928 – 2005 |
| NTRI | 29.05.1968 – 04.11.2005 |
16.01.1979 – 13.12.2005 |
- | - | 14.03.1979 – 10.11.2005 |
10.01.1996 – 12.12.2004 |
1968 – 2005 |
| NTOT | 13.02.1975 – 02.11.2005 |
13.01.2002 – 13.12.2005 |
- | - | 14.03.1979 – 10.11.2005 |
17.01.1996 – 14.12.2004 |
1975 – 2005 |
| PHOS | 15.11.1967 – 04.11.2005 |
16.01.1979 – 13.12.2005 |
- | 01.07.1947 – 21.11.1951 |
14.03.1979 – 10.11.2005 |
12.07.1928 – 14.12.2004 |
1967 – 2005 |
| TPHS | 26.10.1974 – 04.11.2005 |
13.01.2002 – 13.12.2005 |
- | - | 14.03.1979 – 10.11.2005 |
28.04.1932 – 14.12.2004 |
1932 – 2005 |
| SLCA | 27.02.1969 – 04.11.2005 |
16.01.1979 – 13.12.2005 |
- | - | 14.03.1979 – 10.11.2005 |
10.01.1996 – 14.12.2004 |
1969 – 2005 |
| HSUL | - | 14.01.2002 – 13.12.2005 |
- | - | - | 26.01.1996 – 07.12.2004 |
1996 – 2004 |
Table 2: Measured parameters given as GF3 codes (IOC 1987, see also chapter 22) and sample numbers provided by the BALTIC partners. SSAL is included in PSAL, HSUL is included in DOXY as negative oxygen equivalent.
| GF3 | IOW (02/2007) | BSH (not yet included) | SMHI (02/2007) | NERI/LS (02/2007) | MIRYB (02/2007) | IMGW (02/2007) | ICES (02/2007) | total (incl.EMI, GEOMAR) |
|---|---|---|---|---|---|---|---|---|
| PSAL | 1,935,320 | 357,461 | 32,808 | 744,915 | 2,061 | 9,944 | 1,377,132 | 4,249,984 |
| TEMP | 1,975,165 | 406,455 | 29,429 | 745,977 | 2,075 | 9,967 | 1,419,608 | 4,332,531 |
| DOXY | 1,597,990 | 317,960 + 4,550 |
30,669 | 533,158 | 785 | 8,615 | 137,530 | 2,334,450 |
| AMON | 38,962 | - | 3,261 | - | - | 5,679 | 69,593 | 117,495 |
| NTRA | 85,485 | - | 26,502; | - | - | 6,881 | 82,358 | 201,226 |
| NTRI | 83,794 | - | 25,888 | - | - | 6,931 | 76,848 | 193,461 |
| NTOT | 7,683 | 149,484 +149,381 + 72,072 + 10,358 |
3,236 | - | - | 5,116 | 65,931 | 82,266 |
| PHOS | 88,449 | - | 28,355 | - | 174 | 6,919 | 84,224 | 208,121 |
| TPHS | 7,439 | 153,318 | 3,210 | - | - | 5,146 | 67,336 | 83,131 |
| SLCA | 36,552 | - | 27,154 | - | - | 6,803 | 81,794 | 152,303 |
| HSUL | - | - | 608 | - | - | - | 3,668 | 4,276 |
Climatologies 1900 - 2005
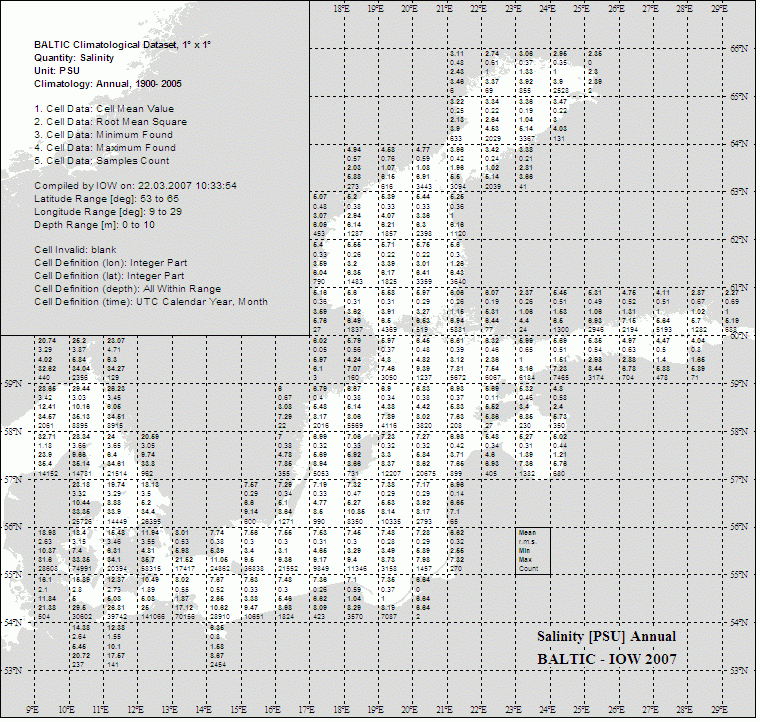
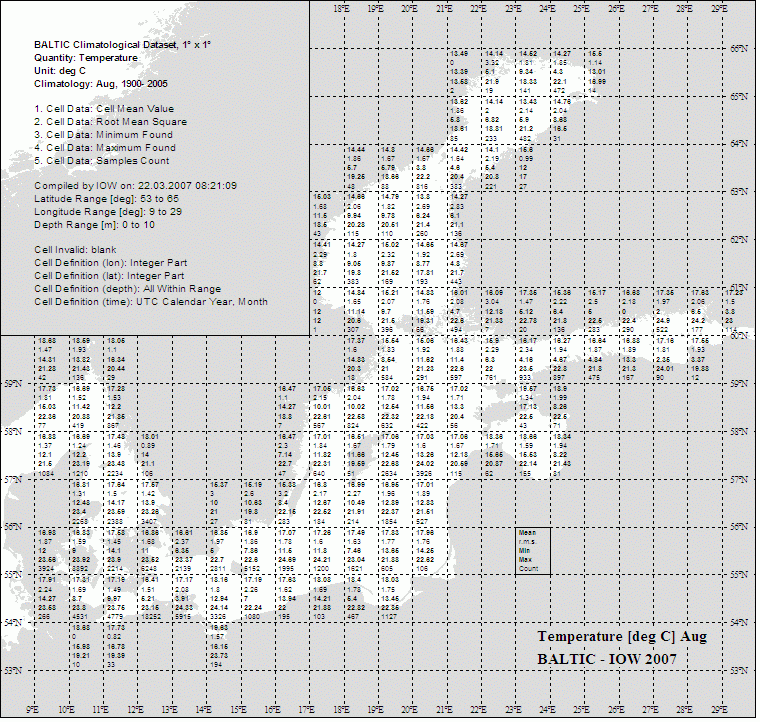
BALTIC climatologies are data sets of the quintuples (mean, rms, min, max, count) for each particular cell (lon, lat, depth, month) averaged over the time period 1900 - 2005. The mean is computed by averaging the time series of monthly means with equal weight given to each non-empty month, in order not to bias the average by months with frequent samplings. The rms is the root mean square deviation of the monthly means from this average. The variables min, max and count, however, do not refer to the number and the extreme values of the monthly means, but rather to the set of single samples used for the computation of the monthly means. Thus, the rms value may be zero even if count > 0 and max > min, if all the samples of a certain cell belong to one and the same calendar month. This definition appeared to be more instructive to the user than the possible alternatives.
As an example, we show here the climatologic surface temperatures for August:
The next figure shows the climatologic surface salinity 1900-2005 of the Baltic Sea from the BALTIC atlas.