Mecklenburg Bight Ocean Model
Model setup
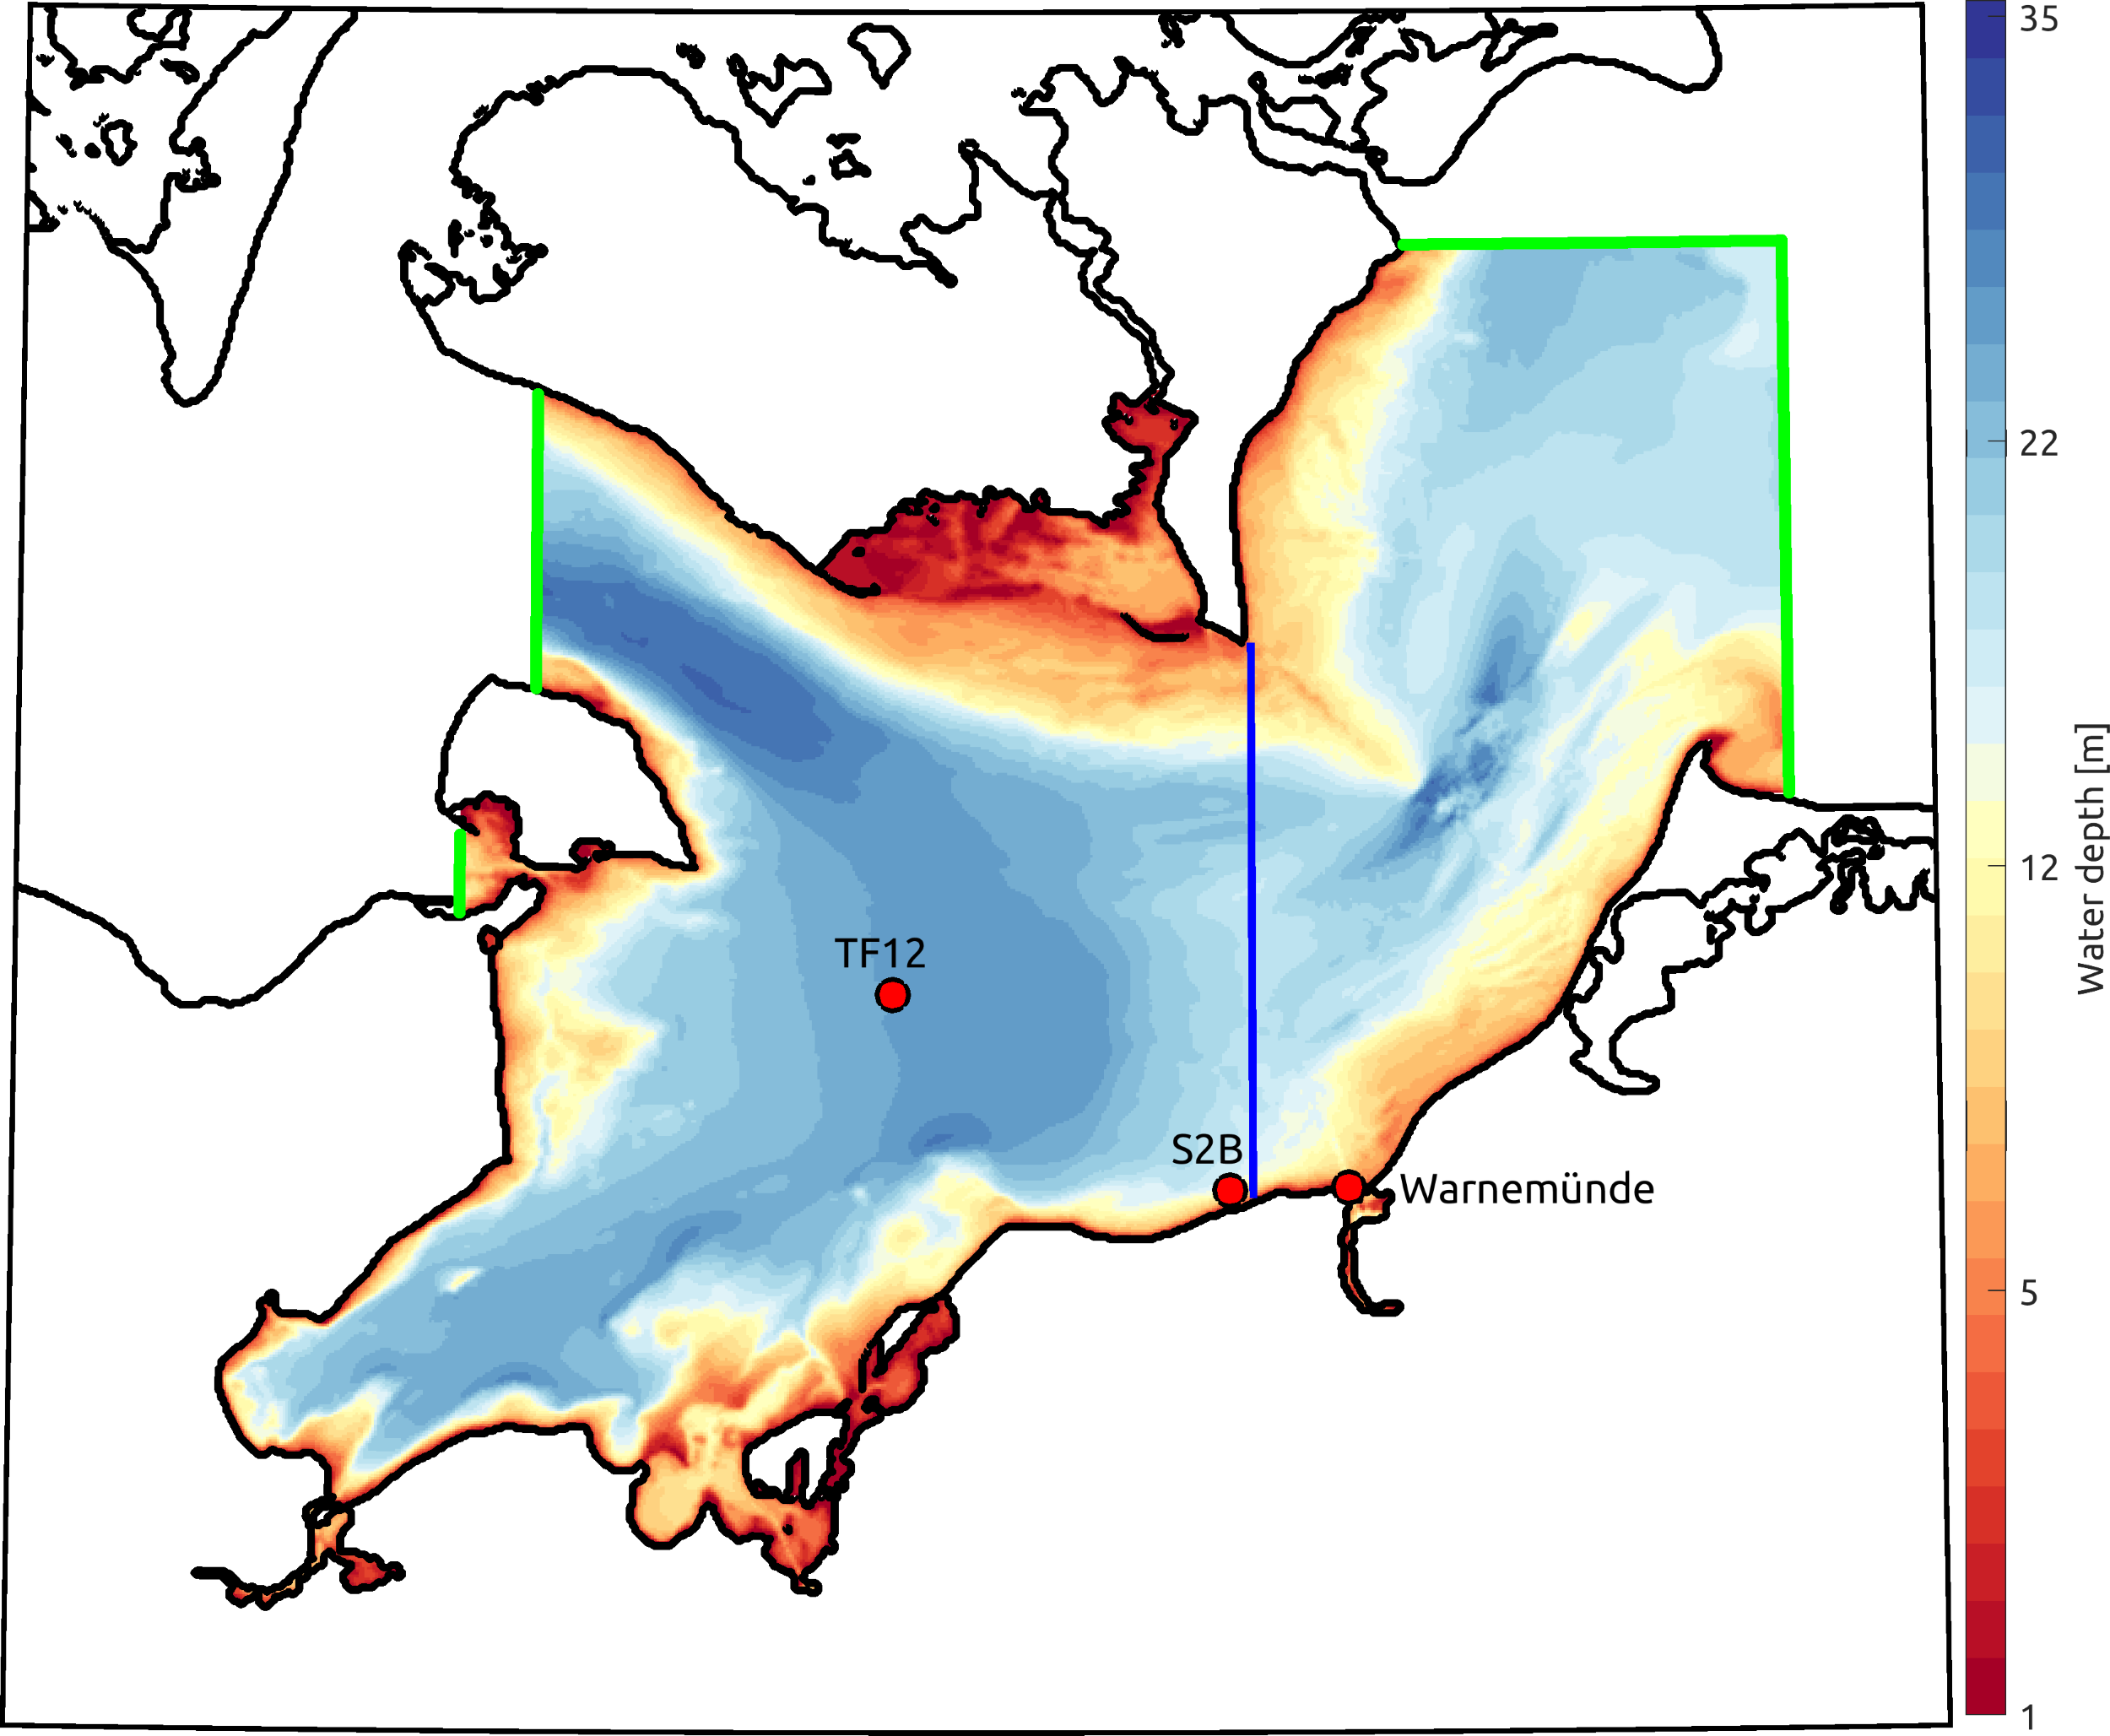
The operational model covers the western Baltic Sea, with a particular focus on the Mecklenburg Bight and the coastal waters around Rostock. The model resolves the regional bathymetry and the major channels and basins connecting the Mecklenburg Bight to the adjacent Baltic Sea, with a horizontal resolution of 200 m and 40 terrain-following vertical levels.
The map shows the model bathymetry, with water depth indicated by the colour scale. Green lines mark the open model boundaries. The red dots indicate the locations used for the time-series analysis: Warnemünde, S2B, and TF12. The Gedser–Rostock transect, shown in blue, is used to illustrate the vertical hydrographic and oxygen structure across the Mecklenburg Bight.
The following sections present the model results at increasing spatial complexity: starting with sea level at Warnemünde, followed by conditions at TF12 and S2B, the vertical structure along the Gedser–Rostock transect, and finally a three-dimensional view of the oxygen distribution.
Sea level at Warnemünde
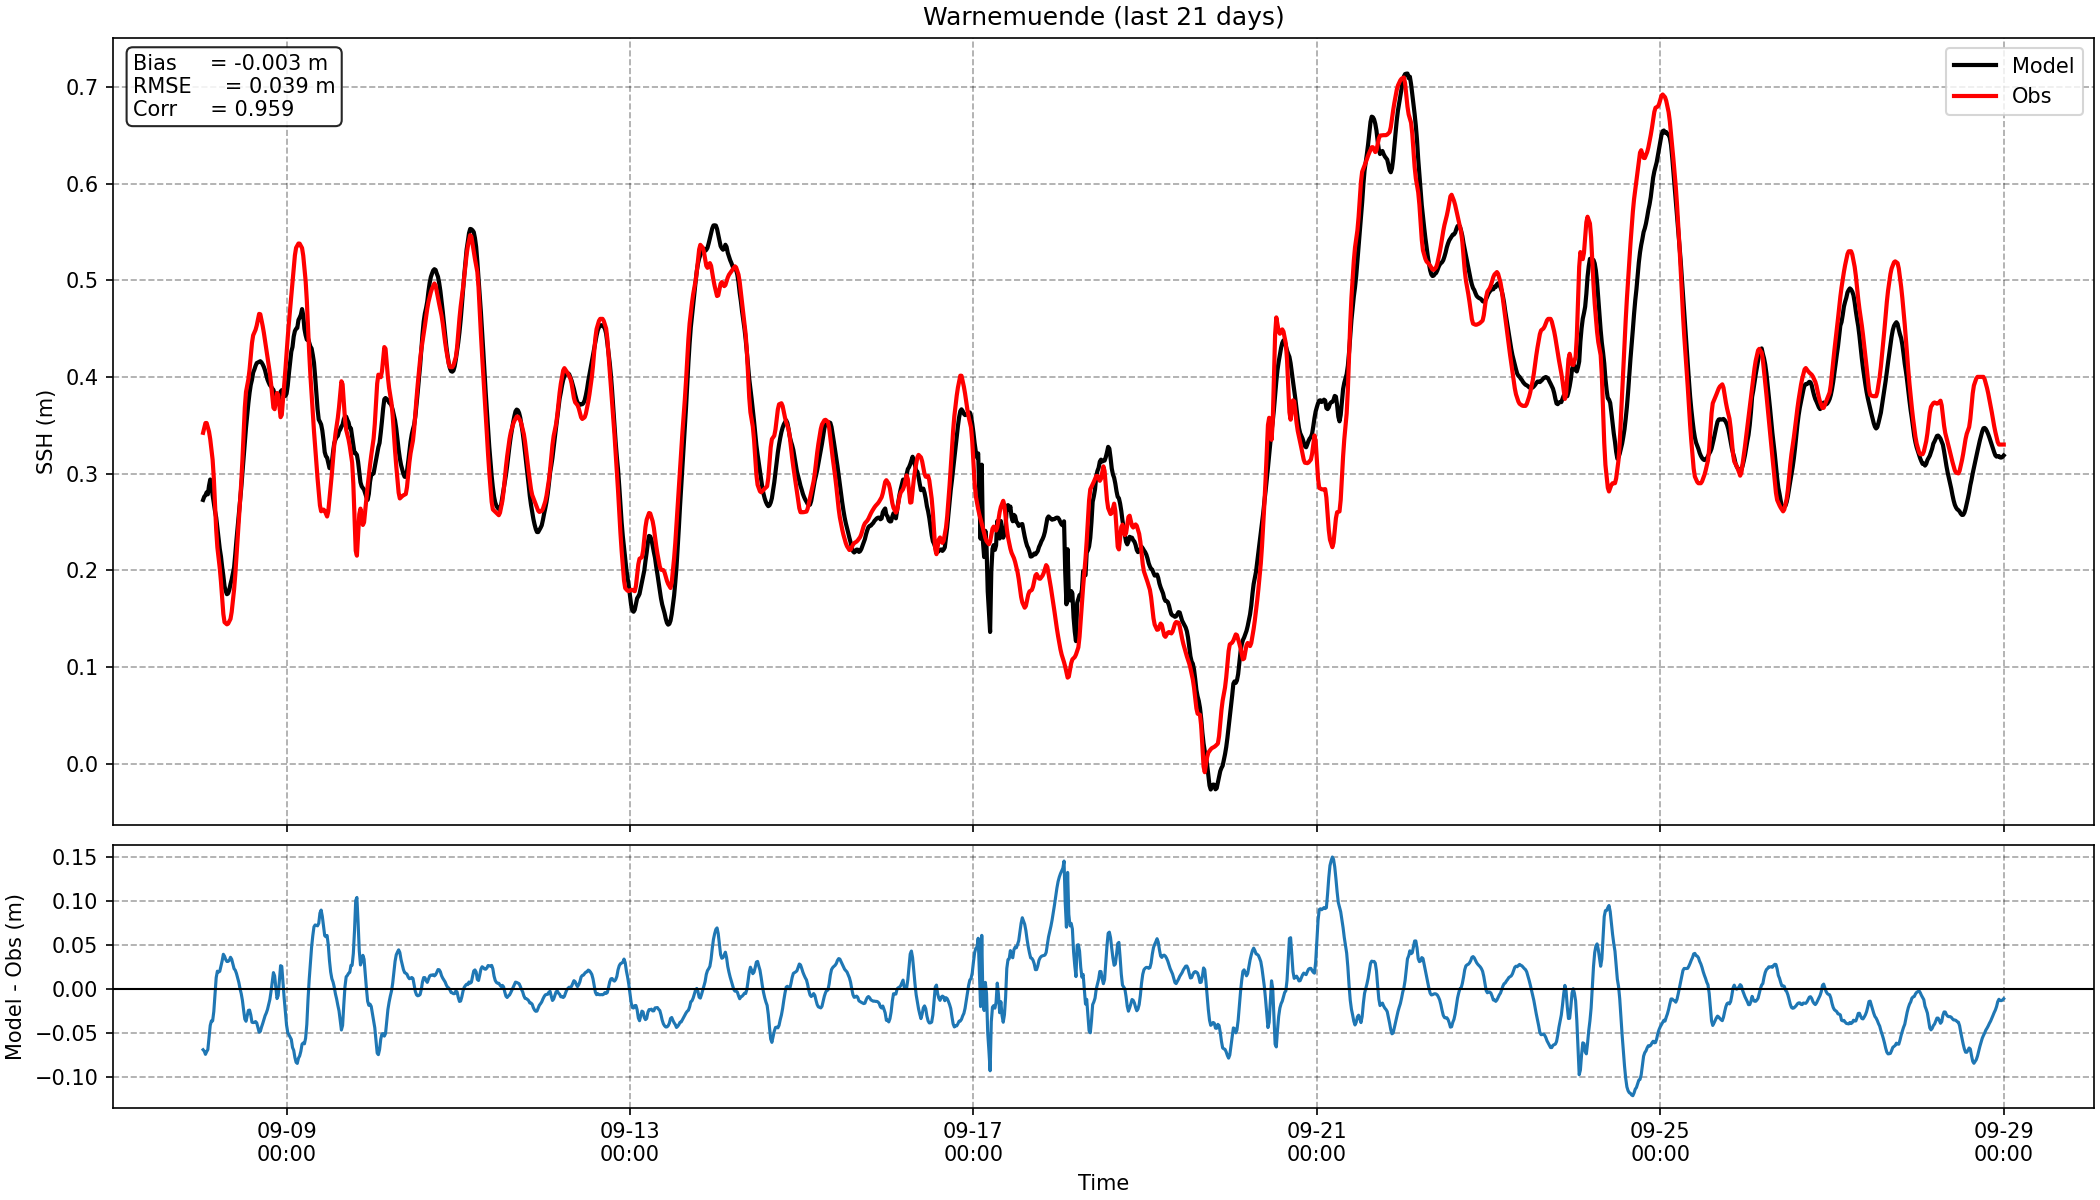
Modelled sea surface height at Warnemünde is compared with tide-gauge observations over the last 21 days. The lower panel shows the model–observation difference, while bias, RMSE, and correlation provide a compact assessment of the model performance.
Hydrographic conditions at TF12
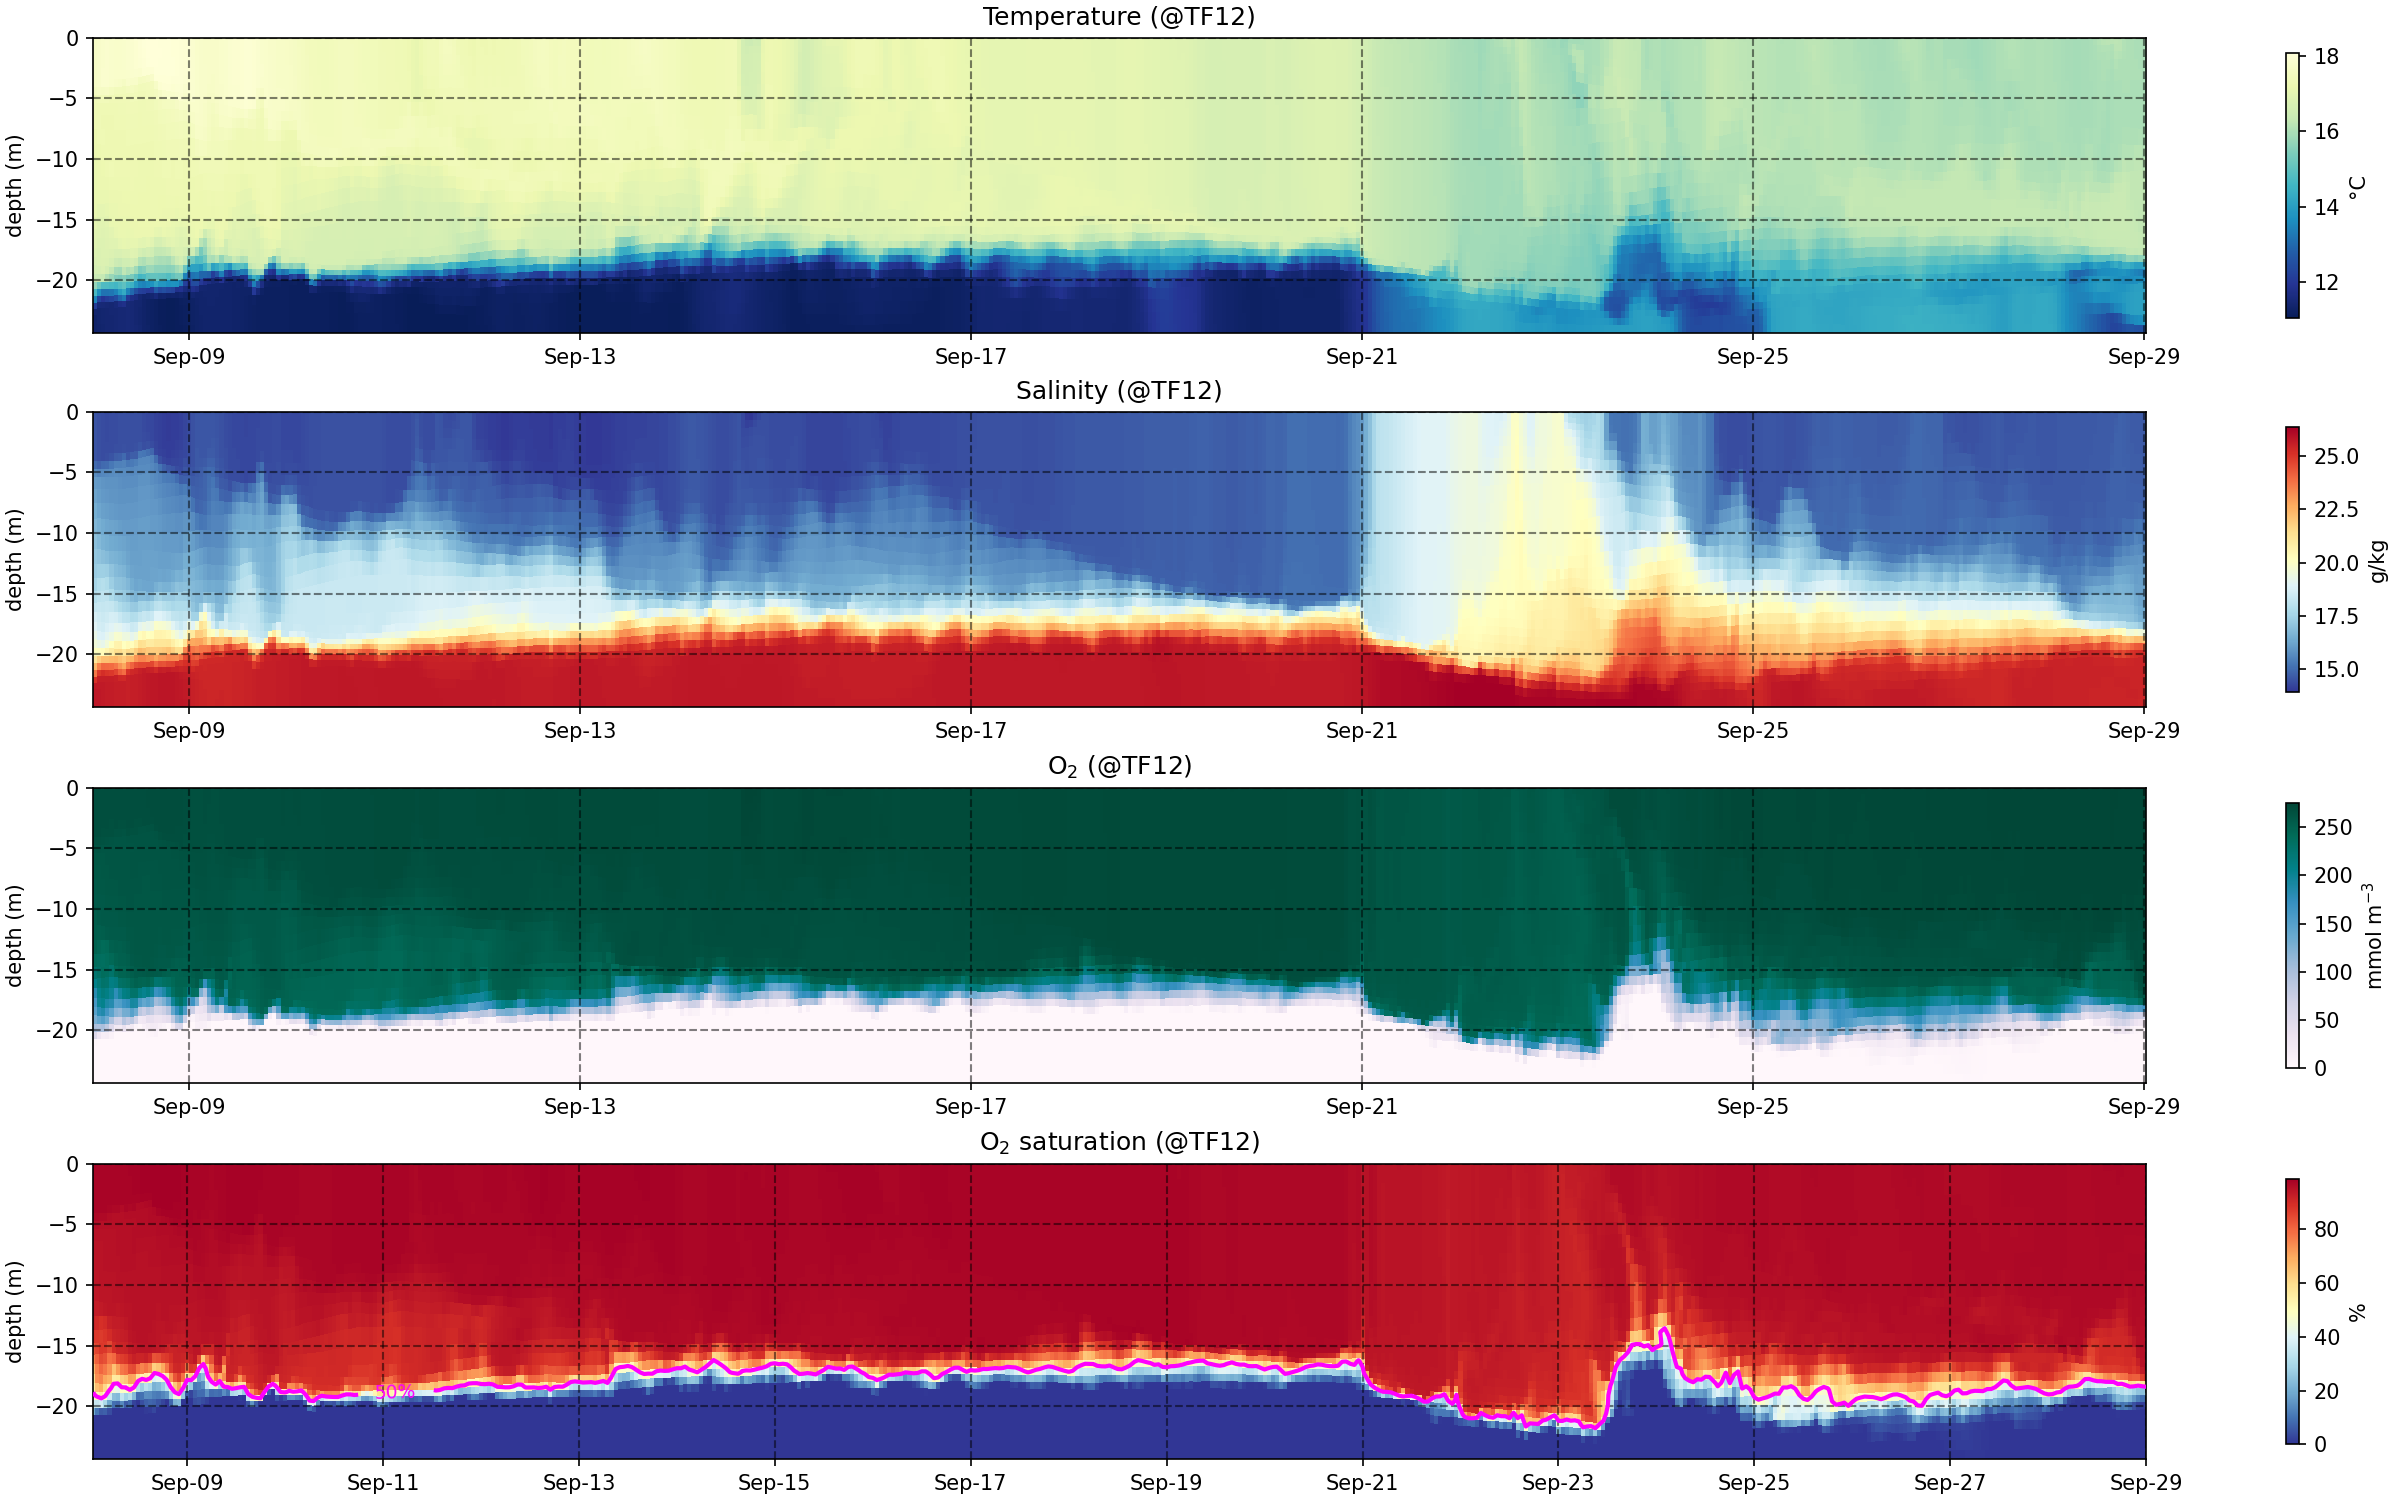
The evolution of the water column at station TF12 over the last 21 days is shown for temperature, salinity, dissolved oxygen, and oxygen saturation. The station is located in the deeper part of the Mecklenburg Bight and therefore provides information on stratification and the development of low-oxygen conditions near the seafloor. The magenta line marks an oxygen saturation of 50%.
Hydrographic conditions at S2B
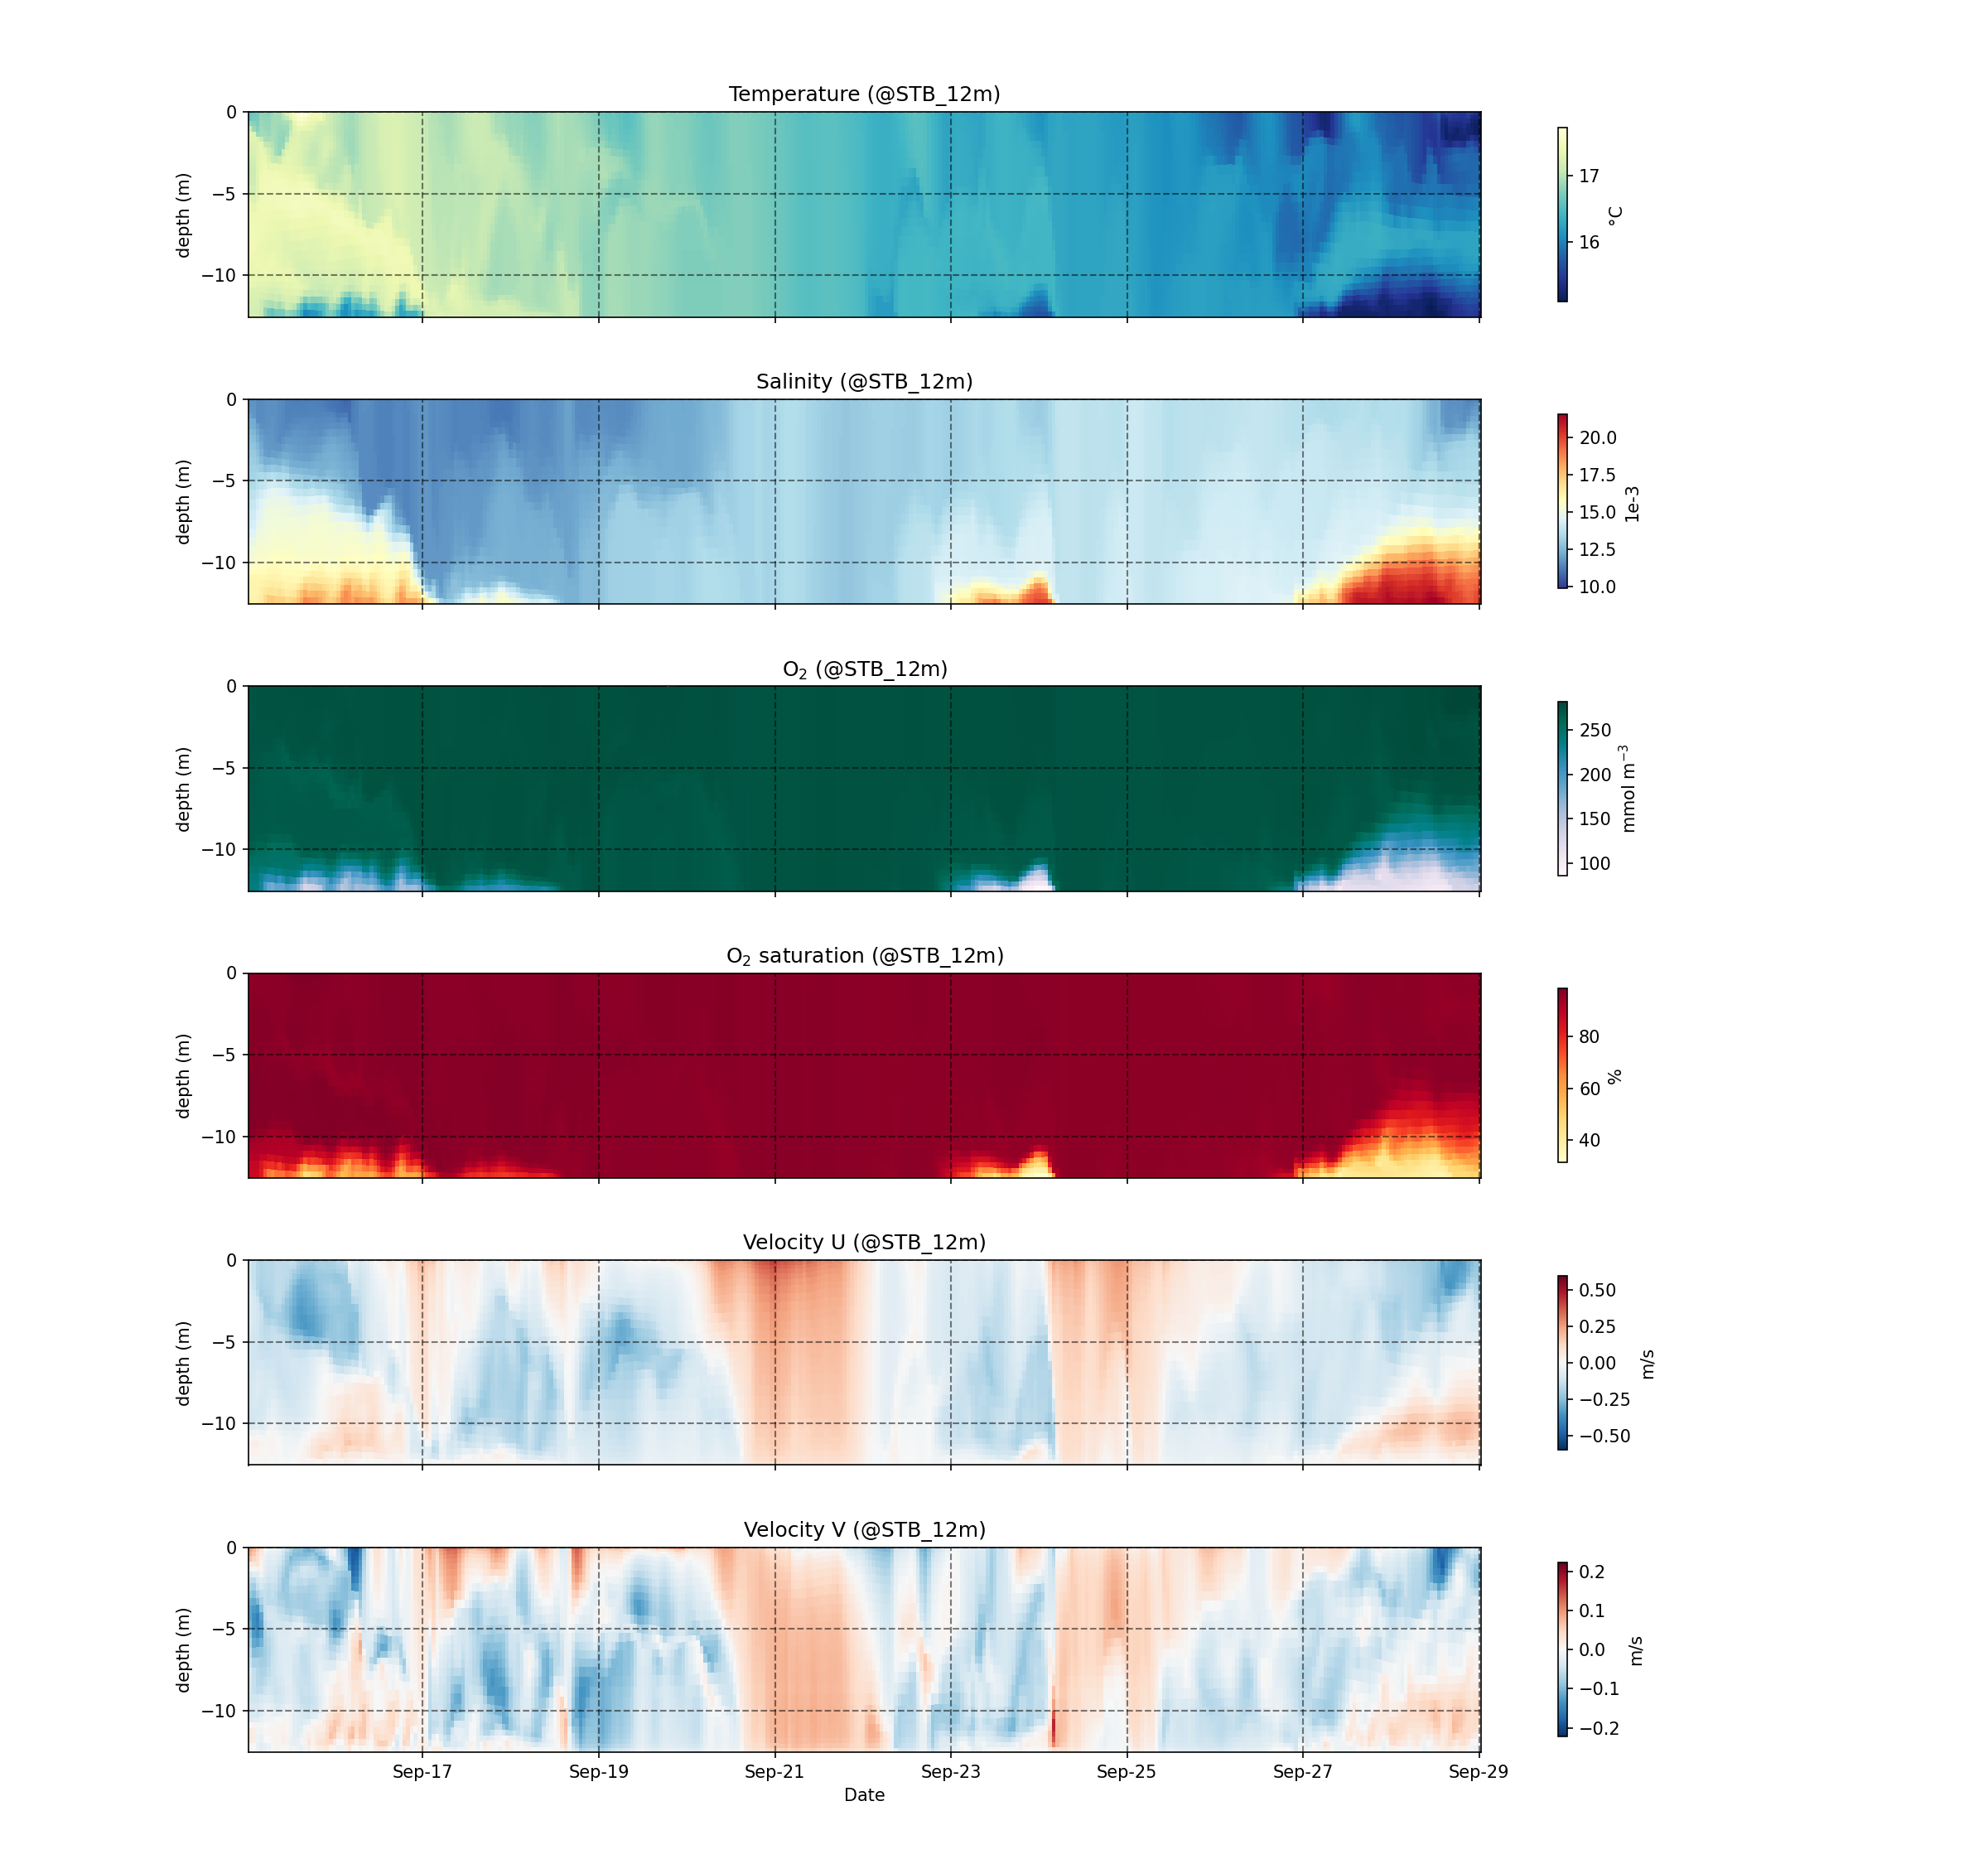
The panels show the vertical evolution of temperature, salinity, dissolved oxygen, oxygen saturation, and horizontal currents at the coastal station S2B. Compared with TF12, the shallower water column responds more rapidly to changes in atmospheric forcing, circulation, and water-mass exchange.
Gedser–Rostock transect
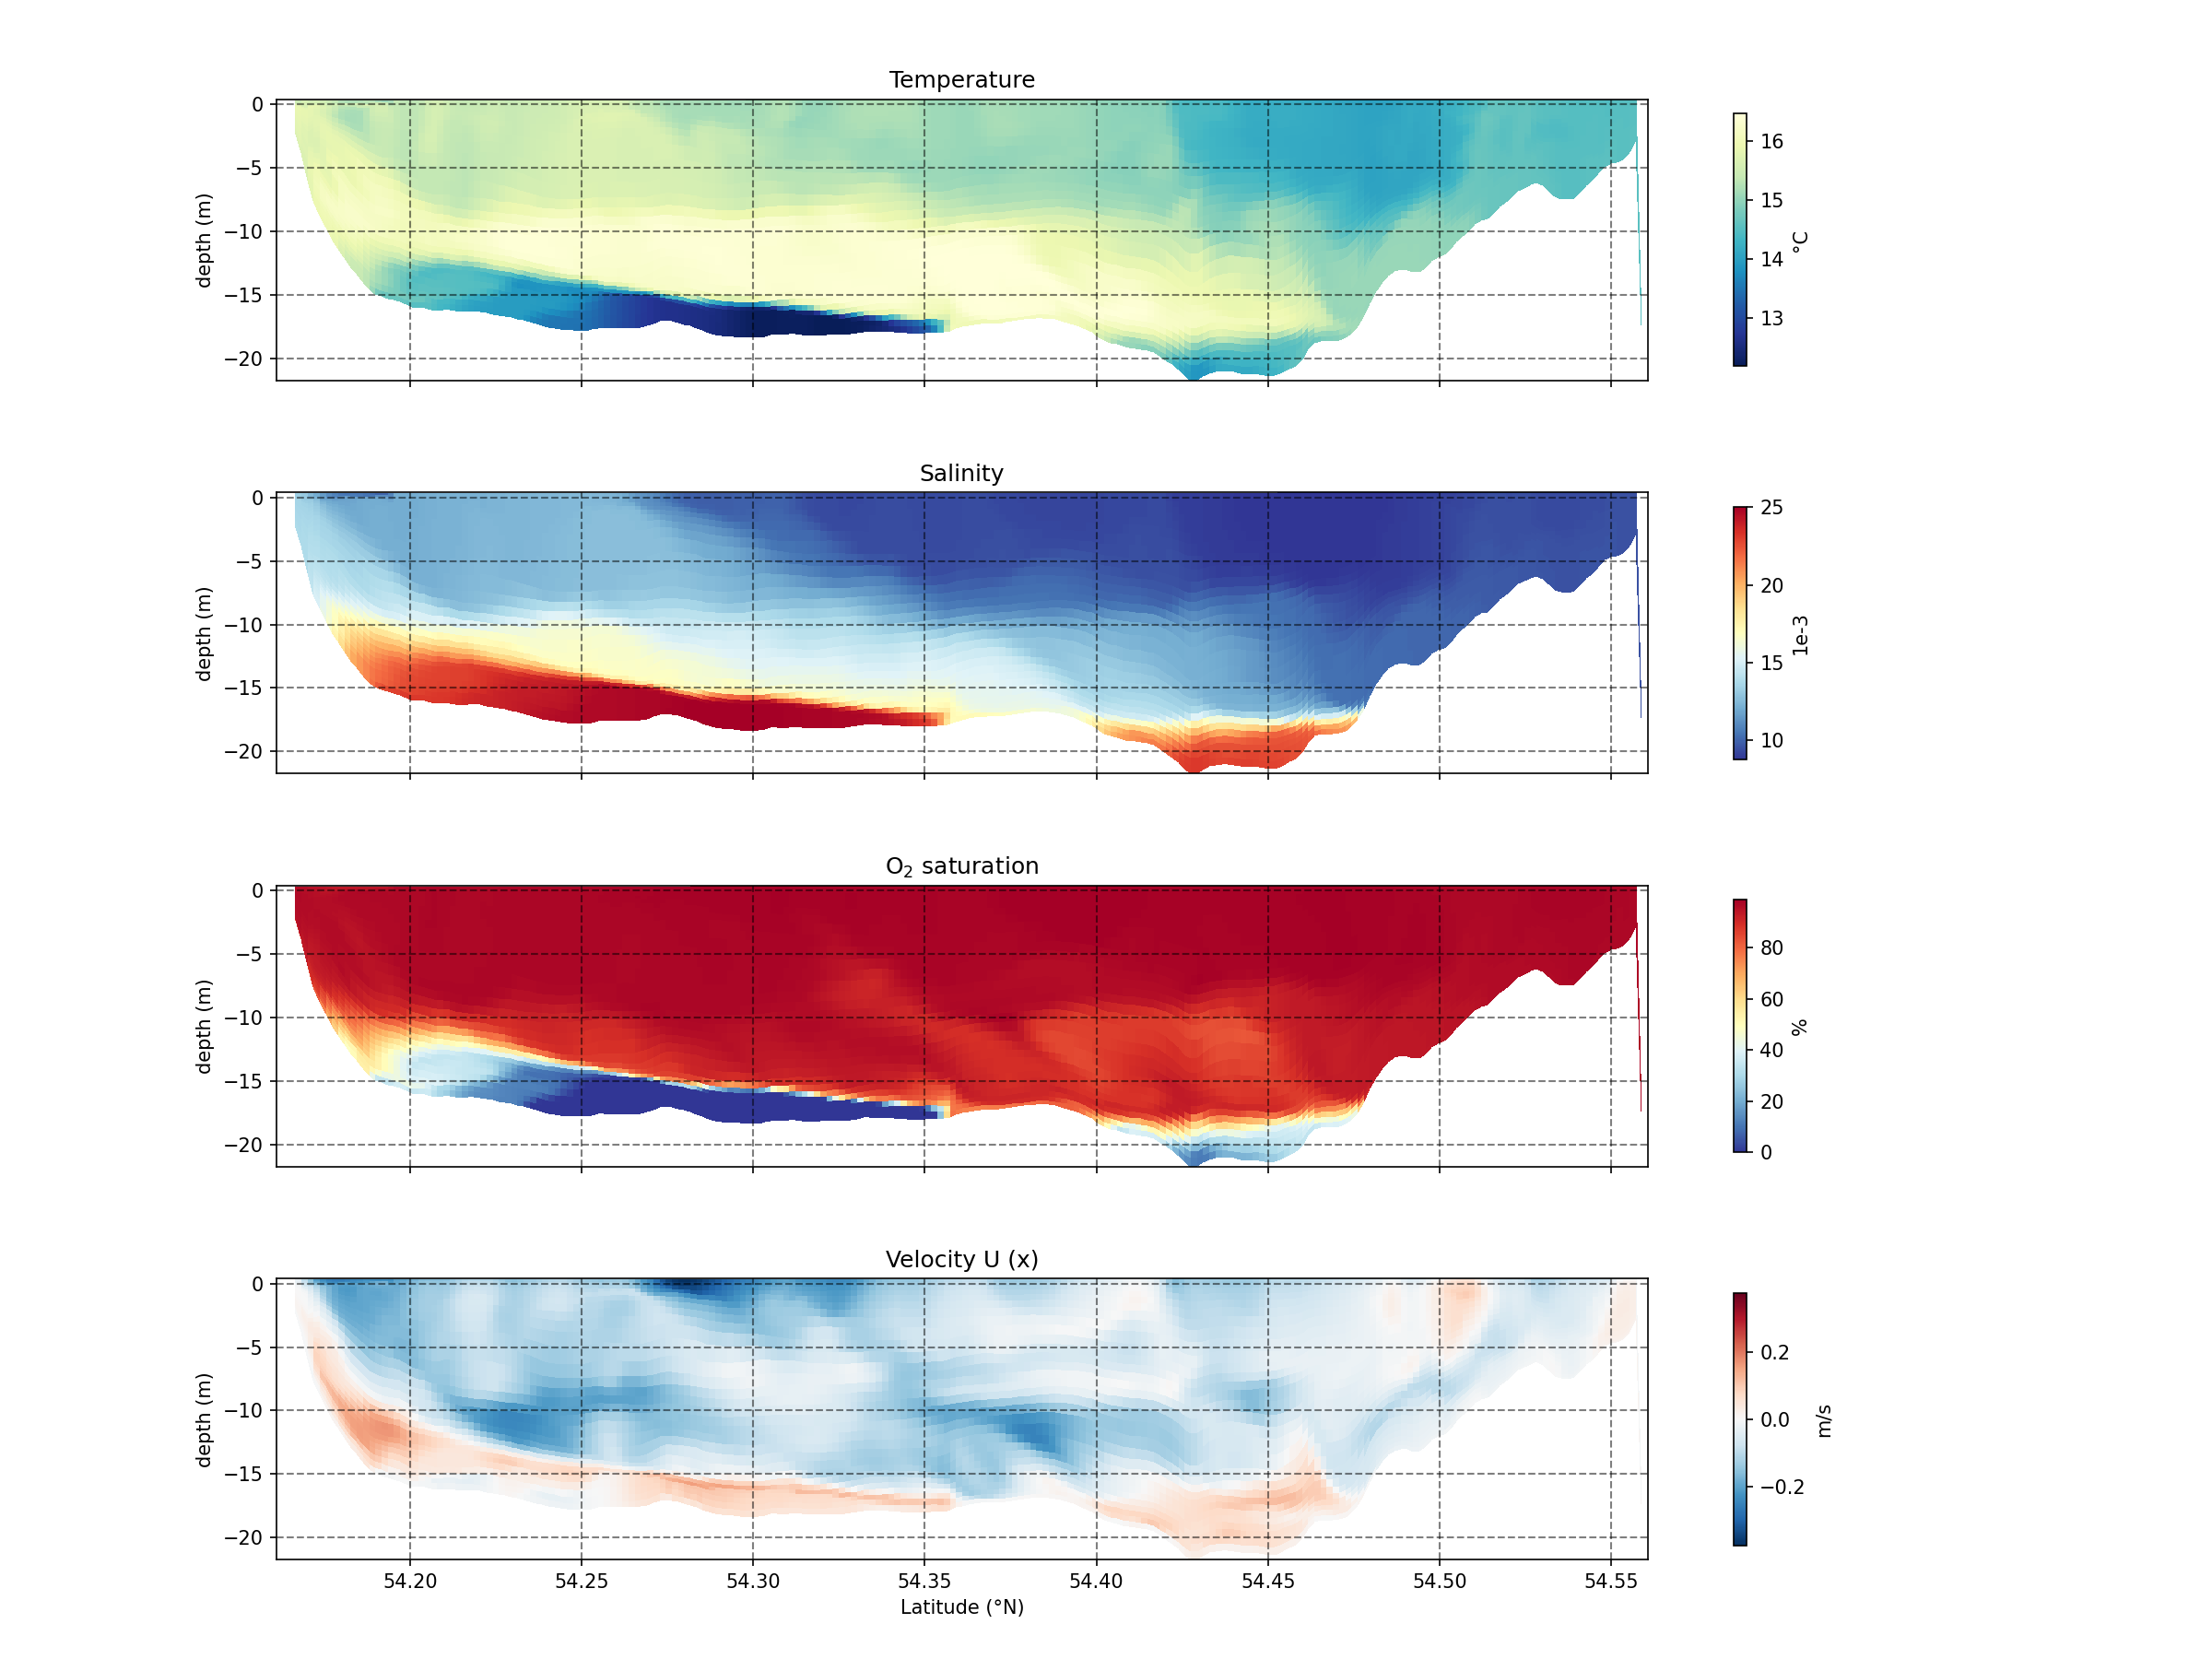
The Gedser–Rostock transect provides a vertical cross-section through the Mecklenburg Bight. Temperature, salinity, oxygen saturation, and currents illustrate the spatial structure of the water masses, including stratification and the extent of oxygen-depleted bottom waters. The transect is shown from south (Rostock, left) to north (Gedser, right).
Three-dimensional extent of oxygen-depleted waters
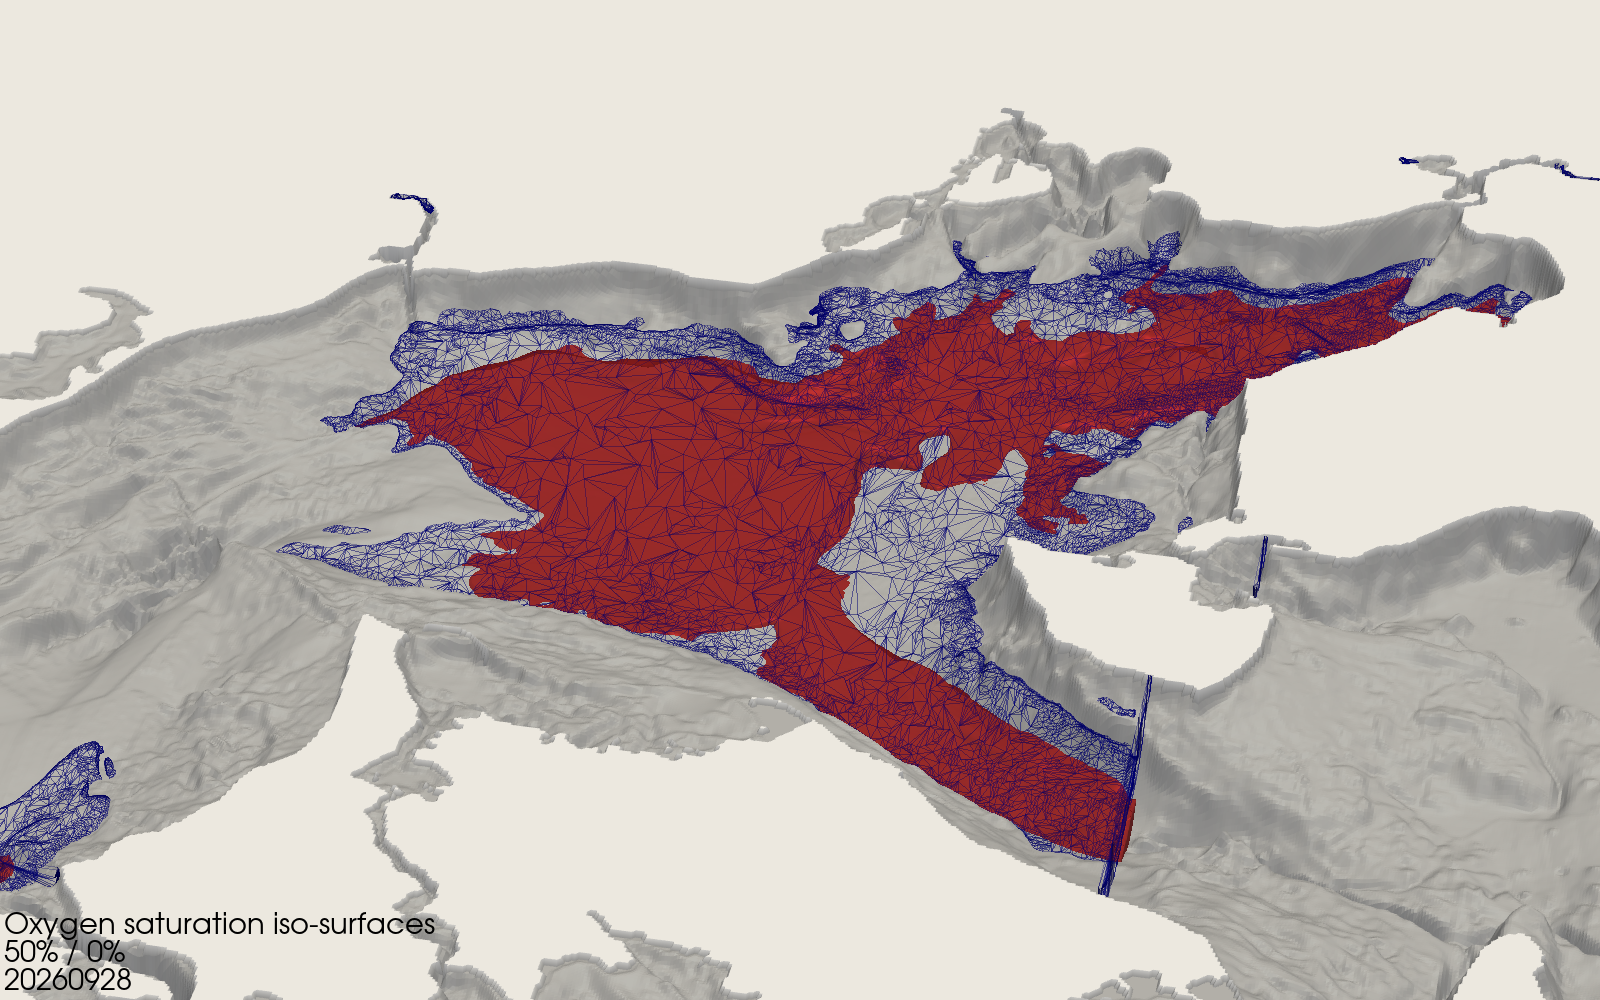
The three-dimensional view illustrates the spatial extent of oxygen-depleted bottom waters across the model domain. The red surface shows the core of severely oxygen-depleted water, with oxygen saturation below 5%. The blue wireframe marks the larger volume with oxygen saturation below 50%. The underlying bathymetry provides the spatial context and highlights the close relationship between oxygen depletion and the deeper basins and channels of the western Baltic Sea.
This representation provides a basin-scale view of the oxygen conditions and complements the local time series at TF12 and S2B and the vertical structure shown along the Gedser–Rostock transect.